Hold your mouse over any of the numbers below for more information, or click.
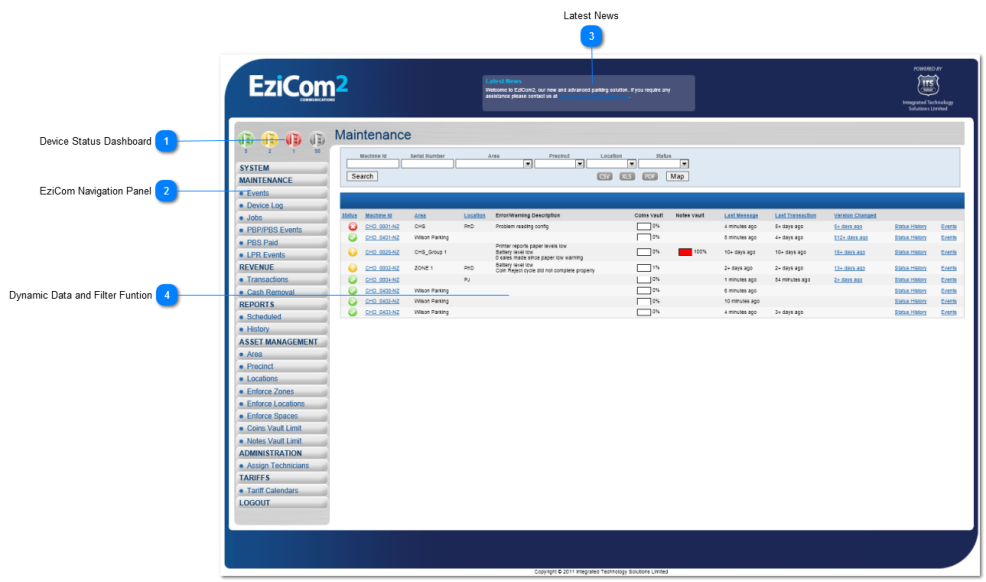
When you first successfully login to EziCom, the below view will be displayed. This is also the same as the Maintenance page, which you can read about here:
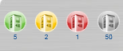
 Device Status Dashboard
Monitor the status of your fleet easily with a quick glance a the device monitor Dashboard.
The Green item shows the amount of machines that are "OK.
The Yellow item shows the amount of machines that are in "Warning" Status.
The Red item shows the amount of machines that are in "Error" Status
|
|
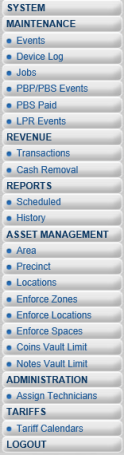
 EziCom Navigation Panel
The EziCom Navigation panel makes it easy for all users to navigate around the site. For more information please click here. |
|
 Latest News
We constantly update this with information related to EziCom, keep your eye out for new info!!
|
|
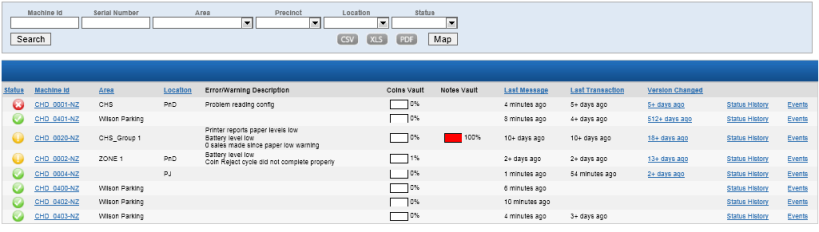
 Dynamic Data and Filter Funtion
All the machine data is displayed in the lower pane, and you can use the Filter options to define the data you wish to view. This page is different for each category.
|
|
 EziCom2 User Guide